Do government programs for the poor actually alleviate poverty?

by Dylan Scott
During the State of the Union Address on January 8, 1964, President Lyndon Johnson outlined what would become known as the War on Poverty, proclaiming, "This administration today here and now declares unconditional war on poverty in America. I urge this Congress and all Americans to join me in that effort....” Johnson undertook a noble mission in that address, one that inspired a generation of lifelong activists committed to eliminating poverty through direct assistance programs for the poor. However, fifty years later, there is little evidence to show that this approach has lowered poverty rates at all.
The War on Poverty began with the implementation of several anti-poverty bills, the core of which was the Economic Opportunity Act of 1964. The act established the now defunct Office of Economic Opportunity (OEO), an agency charged with administering dozens of programs, such as the Community Action Program, that were intended to promote self-sufficiency among the poor. The OEO also set up programs to subsidize energy costs for the poor and provide loans to rural families.
Other major initiatives of the War on Poverty included the Head Start program, the creation of Medicare and Medicaid and the Food Stamp Act of 1964, which made permanent the Food Stamp Program, now called the Supplemental Nutritional Assistance Program (SNAP).
Altogether, programs initiated as part of the War on Poverty account for roughly 70 percent of all public assistance programs today. Estimates of the total cost of the War on Poverty over fifty years range between $15 trillion and $19.8 trillion in today’s dollars. This substantial investment appears to have yielded minimal benefits for poverty reduction. On the day Johnson introduced the war on poverty, the poverty rate in the US stood at roughly 14 percent. It is now approximately 16 percent and has never fallen below 11 percent.
Poverty rates, though fairly constant, have not stayed exactly the same since 1965, as the figure below shows. What then might account for these fluctuations? One plausible answer is that larger trends in nationwide economic growth, or output, account for much of the changes in poverty rates over the last half century.
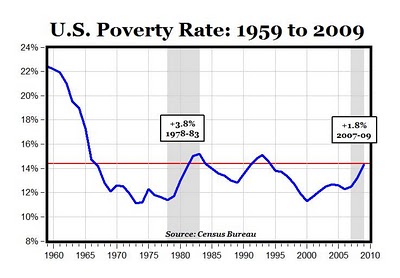
Source: US Census Bureau
The reverse is also possible—changes in poverty rates could drive changes in economic growth, although data on poverty and GDP growth shown in the graph below, illustrate that changes in economic growth tend to drive changes in poverty rates and not the other way around.
The reverse is also possible—changes in poverty rates could drive changes in economic growth, although data on poverty and GDP growth shown in the graph below, illustrate that changes in economic growth tend to drive changes in poverty rates and not the other way around.
Source: World Bank
One bright spot is that although the rate of poverty in the US has remained constant, the actual state of being poor is better now than fifty years ago. A recurring theme in pundits’ talking points is that wages for the middle class and poor have stagnated for decades. However, in a 2011 study, Bruce Meyer and James Sullivan show that many measures of income used to arrive at this conclusion miscalculate individual’s economic well-being by underestimating increases in households’ ability to consume goods and services. The finding implies that while salaries of the poor and middle class remains constant, the value of goods one can buy with that salary is increasing. The study concludes that increased material well-being among lower income groups is largely the result of sustained GDP growth, with programs such as SNAP and housing assistance playing a minimal role.
The long-term impact of increasing output on poverty rates remains unclear, but there is evidence that adequate growth in output can, at minimum, improve the economic-well being of the poor. Where government programs have failed—at a high cost to taxpayers—sustained GDP growth may provide an answer.
